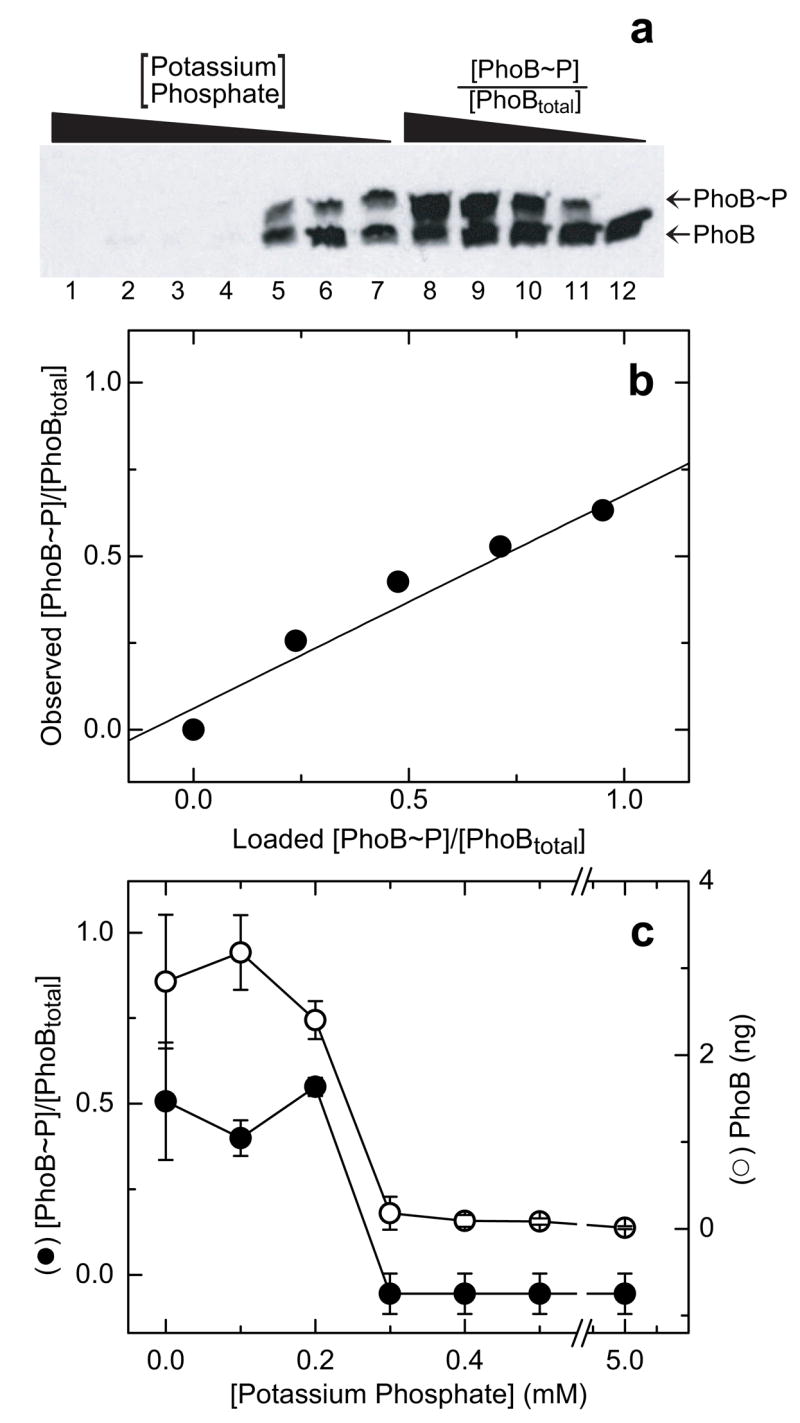
Fig. 7.

Phosphorylation of PhoB in vivo. (a) Western blot of E. coli lysates analyzed on a 25-μM Phos-tag™ acrylamide gel. Lanes 1–7 contain lysates of wild-type E. coli grown under different levels of induction of the PhoR/PhoB phosphate assimilation pathway, corresponding to 5.0, 0.5, 0.4, 0.3, 0.2, 0.1, and 0 mM potassium phosphate in the growth media, respectively. Lanes 8–12 contain standards of 5 ng of PhoBtotal with known fractions of phosphorylated PhoB ([PhoB~P]/[PhoBtotal]) of 1, 0.75. 0.5, 0.25, and 0, respectively, added to lysates of ΔPhoB cells. (b) Plot of the observed fraction [PhoB~P]/[PhoBtotal] versus the fraction [PhoB~P]/[PhoBtotal] in the standards loaded in lanes 8–12 of the gel shown in panel a. Values were calculated as described in the text. The best fit linear trend line is indicated. (c) Effect of media phosphate concentration on levels of PhoB phosphorylation (solid circles) and PhoB protein (open circles). Each [PhoB~P]/[PhoBtotal] was calculated as described in the text and corrected using individual internal standard curves. The amount of PhoB in each sample was calculated from the sum of the intensities of both bands in each lane, corresponding to PhoBtotal, and scaled to ng assuming a linear relationship between intensity and ng, with an average value defined by the standards. Each point represents the average of two independent experiments derived from western blots similar to that in panel a. Error bars indicate the standard deviation from the mean.
