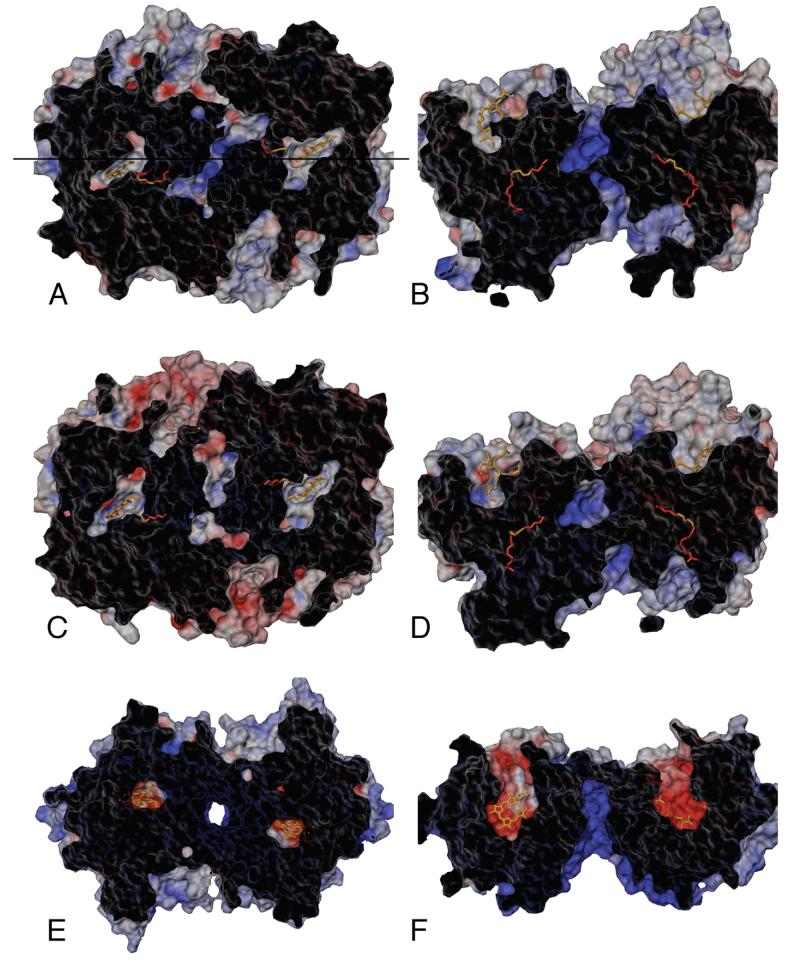
Figure 9.
Electrostatic potential surface views for COX-1 (A, B) and COX-2 (C, D) average structures calculated from the MD trajectories, along with a crystal structure of human myeloperoxidase, MPO (E, F). Panels A, C, and E show top views looking down on the dimers from above the plane of the membrane (as in Figure 1B). Panels B, D, and F show side views of the dimers (as in Figure 1A), which are related to the top views by a 90° rotation about the horizontal axis indicated in panel A. Surfaces were generated using a standard 1.5 Å probe sphere radius, and color-coded (red for negative, blue for positive) according to an electrostatic potential map generated using GRASP (34). Each hollow surface has been sliced with a vertical clipping plane (cut surface appears black) to show the solvent accessible interior cavity surfaces (gray/red/blue), as well as the position of the substrates located in the interior of the protein inaccessible to the 1.5 Å probe sphere.

