
Figure 3.
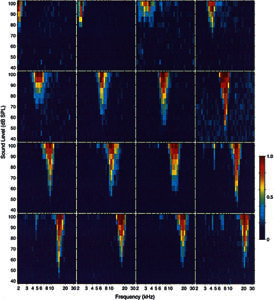
Acoustic frequency response areas recorded with a 16-channel probe in the ICC of a guinea pig. Each of the 16 panels represents measurements from one probe site. In each panel, the abscissa is frequency (3–32 kHz) and ordinate is stimulus intensity (in dB SPL). The normalized response rates are represented in pseudocolor with dark blue equal to spontaneous activity and dark red equal to maximum driven response. Response areas from sites distributed sequentially along the probe from most superficial to deepest are distributed from left to right and from top to bottom. GP24.