
Figure 5.
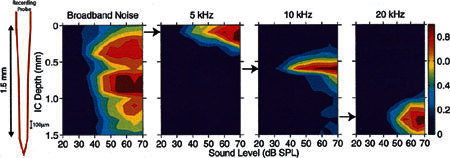
Spatial tuning curves (STCs) evoked by broadband noise and tone bursts at 5, 10, and 20 kHz. In each STC, the vertical dimension is ICC depth (i.e., distance along the recording probe) and the horizontal dimension shows stimulus intensity. The colors represent normalized spike rates indicated by the pseudocolor scale shown at the right. In the noise STC, activity was broadly distributed even at low stimulus levels. In each tone-evoked STC, activity was spatially restricted at near-threshold levels and spread across the cochleotopic axis as tone intensity increased, In most cases, the region of lowest threshold corresponded to the response focus, i.e., region of maximum response. The response focus shifted ventrally as the stimulus frequency increased. GP16.