
Figure 2.
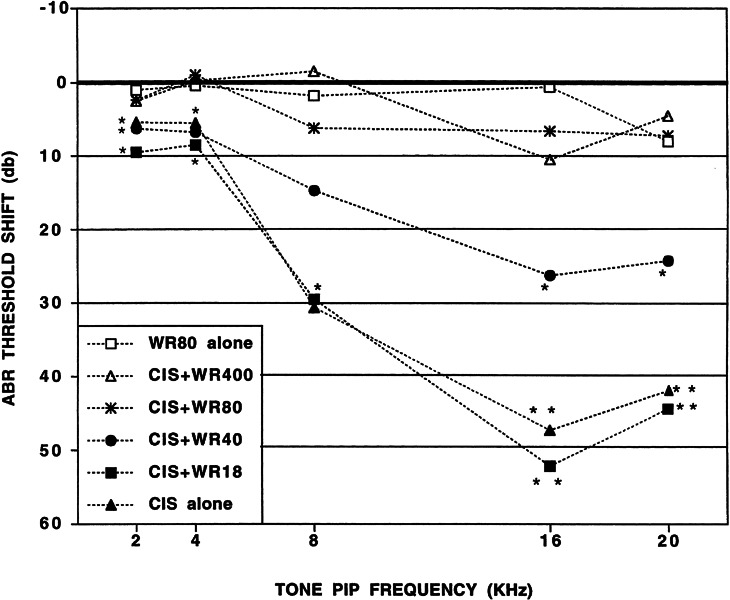
Mean ABR threshold shifts as functions of treatment condition and tone pip frequency. The Control group’s data are represented by the normalized values of 0 dB. The pooled standard error (SE) values for the 2, 4, 8, 16, and 20 kHz conditions were 0.8, 0.9, 2.7, 3.8, and 3.3 dB, respectively; *signifies mean is significantly different from Control values; ** signifies mean is significantly different from corresponding Control and CIS + WR40 values.