
Figure 3.
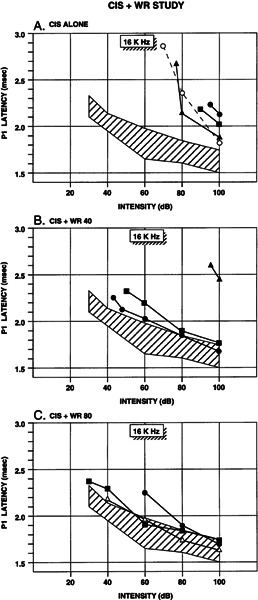
ABR latency–intensity (L–I) profiles from typical animals in the CIS, CIS + WR40 and CIS + WR80 groups (stimulus = 16,000 Hz tone pips). The shaded region is the range of normalcy derived from Control data (means ± 2 SD). The thin dark lines show the L–I profiles of individual animals. A. Animals in the CIS group had L–I profiles suggestive of moderate to severe recruitment-type sensorineural hearing loss (SNHL). B, C. Animals in the CIS + WR40 and CIS + WR80 groups showed progressively greater protection from CIS-induced SNHL.