
Figure 4.
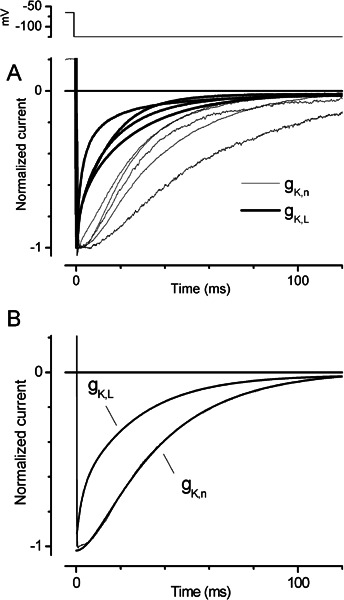
Differences in the deactivation kinetics of gK,n and gK,L. gK,L deactivation followed a single- or double-exponential decay function, while gK,n deactivation had a sigmoidal onset. A. Steps from −64 to −124 mV (gK,n) or -69 to −129 mV (gK,L) caused deactivation of currents through both gK,n, and gK,L ; thin traces are for gK,n from 5 outer hair cells, thick traces are for gK,L from 5 type I cells. Currents are normalized to the peak current at the beginning of the step. B. Fits (thick lines) to the deactivation of two of the data traces in A (thin lines; obscured by fits except at the step onset). The type I data were fit by a double-exponential function [eq.(4)]: A1 = −264 pA, τ1 = 2.5 ms, A2 = −684 pA, τ2 = 26.8 ms. The OHC data were fit by Eq.(3): τ1 = 7.8 ms, τ2 = 33.1 ms.