
Figure 6.
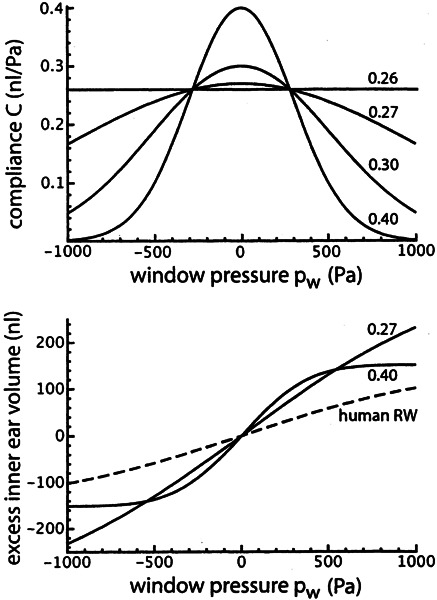
Upper panel: assumed Gaussian shape for window compliance as a function of window pressure for four different values for C at pw = 0. The curves intersect at C = 0.26 nl/Pa for pw = 280 Pa. Lower panel: Integrals of two curves in the upper panel and, for comparison, the relation between inner ear excess volume and window pressure for the human round window.