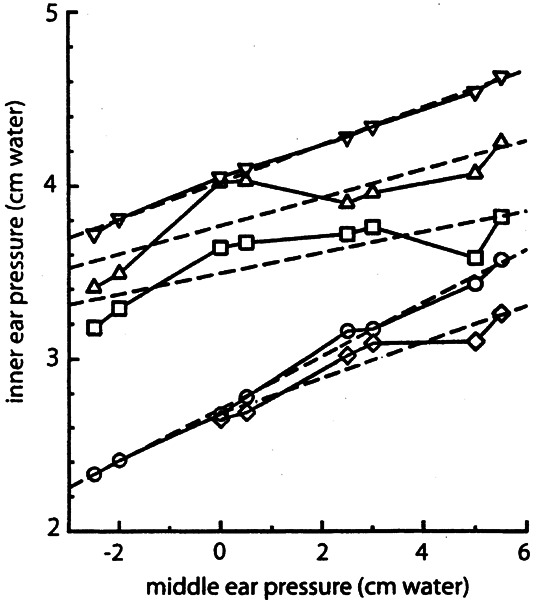
Figure 8.

Permanent change of inner ear pressure for five ears (denoted with different symbols) for different (constant) values of middle ear pressure. Dashed lines are linear least squares fits to the data from these five ears. The average slope of these lines is 0.10.
