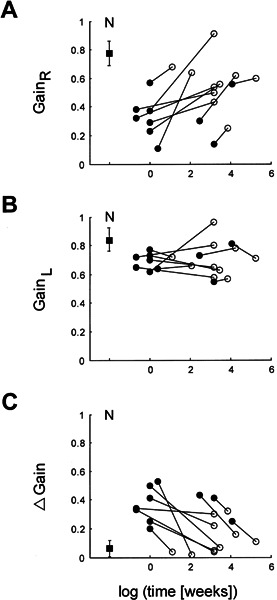
Figure 3.

Individual gain values in the ten patients who could be tested twice at different time periods after the onset of vestibular neuritis. Panels and scales are as in Figure 2. Filled circles: first measurements; open circles: consecutive measurements; filled square: average values in healthy subjects (error bars: ±1 SD).
