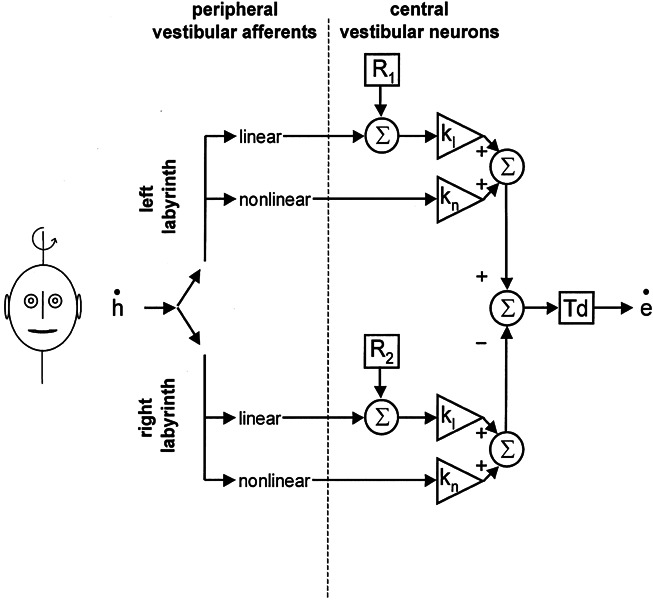
Figure 4.

Simplified
diagram of the model described by Lasker et
al. (2000). The input to the vestibulo-ocular reflex is
angular head velocity ( ). This signal is
passed through linear and nonlinear pathways. kl and kn represent the corresponding central
gain elements of these two pathways. R
denotes the resting rate of central vestibular neurons, which is added to
the linear pathway. Td: time delay of the reflex (set to 7 ms in our
simulations).
