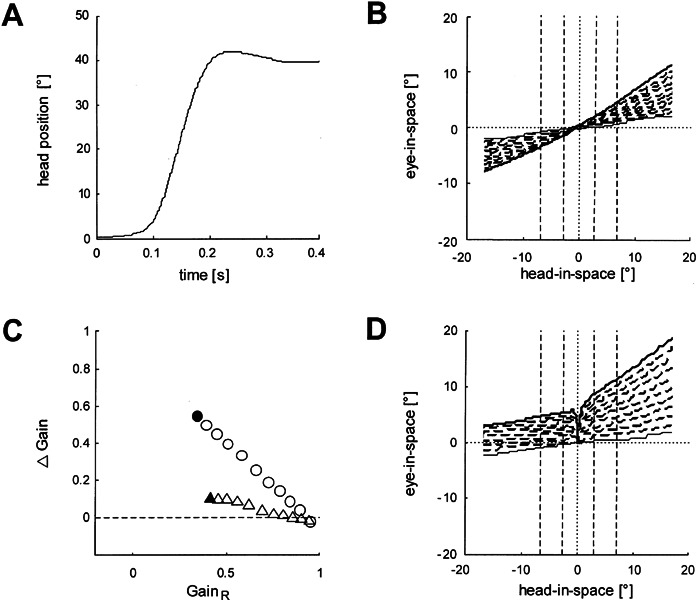
Figure 5.

Performance of the model by Lasker et al. (2000) upon an actual head impulse (applied by A.P.) as input (duration = 0.4 s; amplitude = 40°; peak velocity = 470°/s; peak acceleration = 12,000°/s2). A. Position trajectory of the head impulse. The small overshoot is typical. B. Eye-in-space vs. head-in-space in the presence of an increasing right-sided deficit. Each trace represents the VOR simulated by the model in the presence of a right-sided vestibular deficit. The function of the right labyrinth was reduced in 10% steps (dashed lines) from normal (no deficit, thin solid line) to total loss (no function, thick solid line). No central elements were changed. Dashed vertical lines indicate intervals for determining the gain (see Methods). C. Gain difference (Δ Gain) as a function of ipsilesional gain (GainR). Data points represent the gains from panels B (triangles) and D (circles). Filled symbols: gains as a result of a total unilateral deficit. D. Axes and lines as in B, but ipsilateral R (90 → 80 Hz), contralateral kl (1 →1.2), and contralateral kn (0.00001 → 0.000025) were changed proportionally to the peripheral vestibular deficit. Note that the spontaneous nystagmus manifests itself indirectly by eye-in-space displacements to the right evoked by the slightest head-in-space movement to either side, although it cannot be seen directly in this plot.
