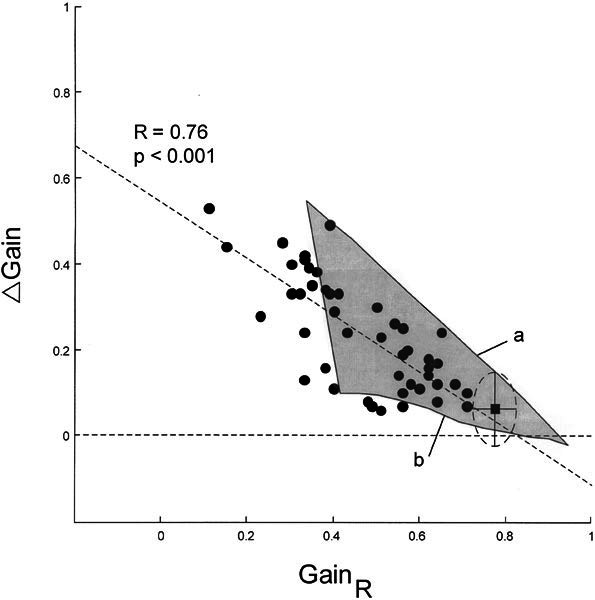
Figure 6.

Comparison of patients’ data with that from the model by Lasker et al. (2000) Δ Gain: differences between gains; GainR: gains during head impulses toward the right side, which was always the weaker side. Filled circles: individual testing sessions (N = 47 in 37 patients); filled square: average data point from healthy subjects (ellipse with horizontal and vertical radii: ±1 SD); horizontal dashed line: Δ Gain = 0; oblique dashed line: linear regression through data cloud. Gray area: all possible output values of the model when one varies the unilateral peripheral deficit (0%–100%) and gradually changes the central elements in proportion to the deficit (see Fig. 4). Line a: full changes of central elements (corresponding to Fig. 5D). Line b: no changes of central elements (corresponding to Fig. 5B).
