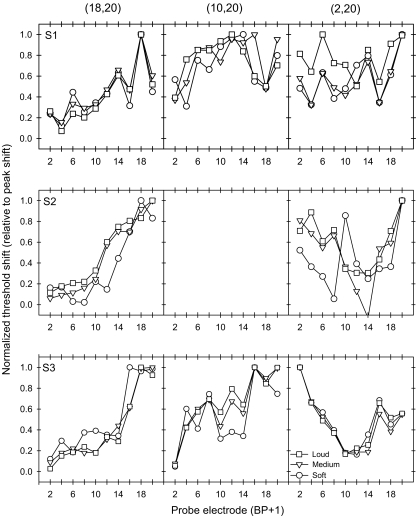
Fig. 5.
Normalized threshold shifts for the 3 CI subjects with masker Set B. Each row of plots shows data for individual CI subjects; each column of plots shows data for each masker electrode pair. The open symbols show normalized masked threshold shifts for maskers presented at soft, medium and loud listening levels. In each curve, masked threshold shifts were normalized to the peak shift.

