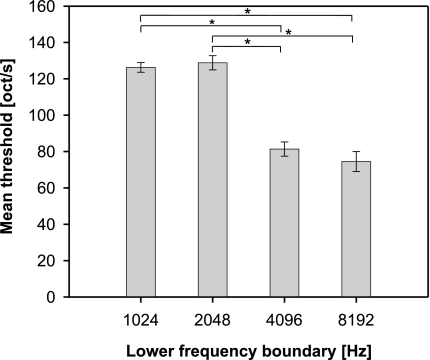
Fig. 6.
Influence of the lower frequency boundary of FM stimuli on discrimination performance. Threshold sweep speeds (in octaves/s) are given as the least square means (±standard error) from an ANOVA analysis (see text). Multiple comparisons (P < 0.05, indicated above bars) revealed significantly reduced mean thresholds for stimuli with high frequency content (lower frequency boundary 4 kHz or higher) compared to stimuli with additional low frequency content (lower frequency boundary 2 kHz or lower).

