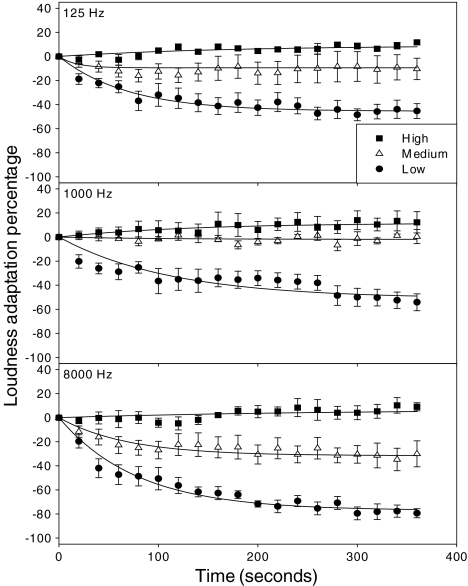
Fig. 1.
Average percentage of loudness adaptation as a function of time in seconds after the onset of a continuous tone from five normal-hearing subjects. The vertical bars indicate ±1 standard error. The top, middle, and bottom panels represent stimulus frequency at 125, 1,000, and 8,000 Hz, respectively. Circles, triangles, and squares represent stimulus level at 30, 60, and 90 dB SPL, respectively. The lines represent best fit to the data by Eq. 2 described in the main text.

