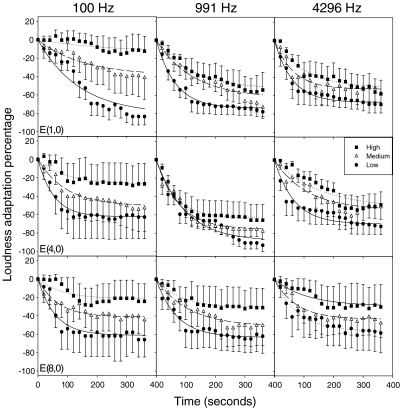
Fig. 2.
Mean percentage of loudness adaptation for five cochlear implant subjects as a function of time in seconds after the onset of a pulse train stimuli. The vertical bars indicate ±1 standard error. The nine panels represent nine different combinations of stimulation frequency and stimulation electrode pairs. Within each panel, circles, triangles, and squares represent low, medium, and high stimulus levels, respectively. The lines show the linear regression fit by Eq. 2 in the main text.

