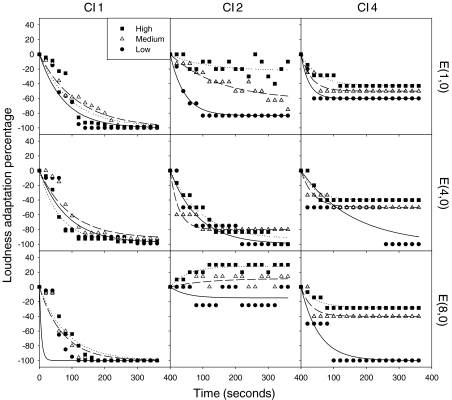
Fig. 3.
Loudness adaptation for three cochlear implant subjects as a function of time in seconds at stimulation rate 991 Hz. Three columns show data from CI-1, CI-2 and CI-4, respectively. The three rows show the electrode pairs (1,0), (4,0) and (8,0), respectively. Within each panel, circles, triangles, and squares represent low, medium, and high stimulus levels, respectively. The lines show the linear regression fit by Eq. 2 in the main text.

