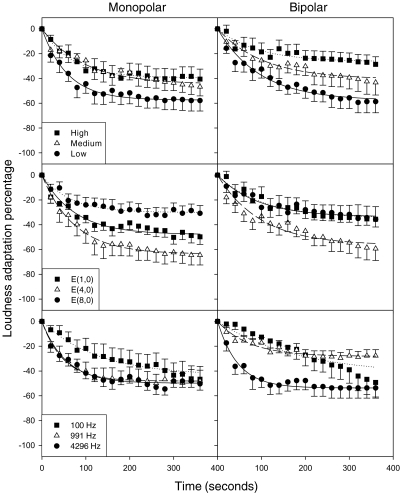
Fig. 5.
Average percentage of loudness adaptation (across levels, electrode pair and stimulation frequency) comparison between monopolar and bipolar stimulation mode for all subjects as a function of time. The left column is the monopolar mode and the right column is the bipolar mode. The first row is the average across all levels. The second row is the average across all electrode pairs, and the third row is the average data across all stimulation frequencies. The vertical bars indicate ±1 standard error.

