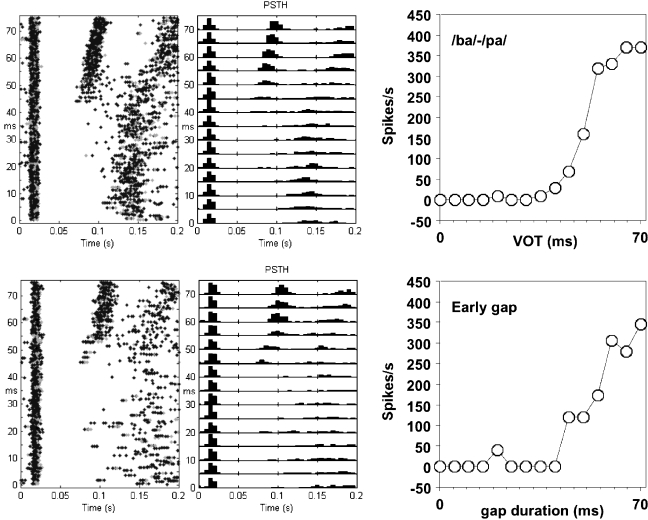
Fig. 3.
Dot displays (left column), poststimulus–time histograms (middle column), and peak firing rate (FRmax) as a function of VOT or early-gap duration (right column). The upper row shows data for a /ba/–/pa/ continuum; the lower row shows data for a gap-in-noise continuum recorded at the same site. Different colors in the dot display indicate different spike-sorted units.

