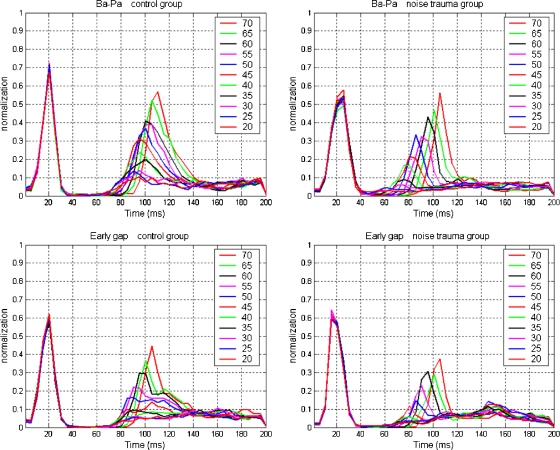
Fig. 4.
Population PSTHs for controls (left column, N = 100) and noise-exposed animals (right column, N = 62) for the /ba/–/pa/ continuum (top row) and the gap-in-noise continuum (bottom row). Before averaging, the responses were normalized on the largest on-response to the leading noise burst. Responses to the leading noise burst overlap for all VOT or gap-duration conditions; those for the vowel or trailing noise burst depend on VOT or gap duration (indicated by color).

