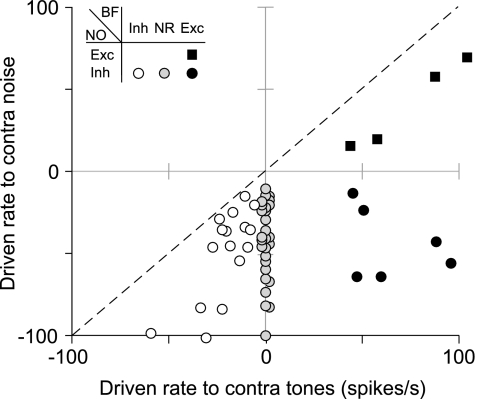
Fig. 3.
Magnitude of contralateral effects on DCN type IV units. Comparison of each unit's maximum driven rate for noise vs. tone stimulation. The symbol used to plot each point indicates the effect that contralateral stimuli had on the unit (see legend). Data points along the center ordinate are shifted slightly to avoid overlap. The dashed line indicates equal driven rates to both stimuli. Note that most units are weakly, if at all, inhibited by tones but are inhibited strongly by contralateral noise (open and gray circles).

