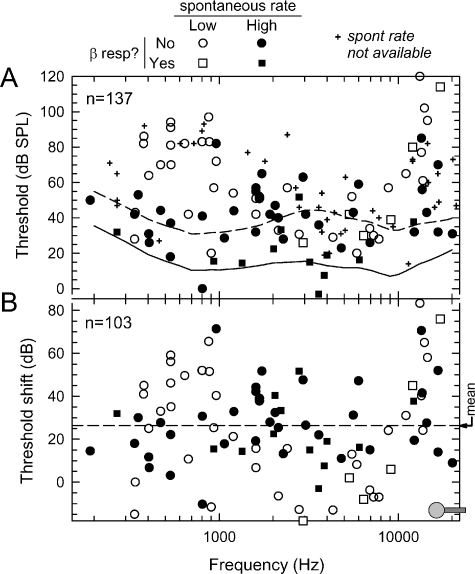
Fig. 1.
Summary of basic acoustic properties of fibers of this study. (A) Acoustic thresholds and best frequencies for 137 fibers. Symbol types classify each fiber as low or high SR and whether or not electric stimulation evoked an identifiable β response. Two contour lines are shown. The solid contour represents the mean thresholds for high-SR fibers of normal-hearing cats (Liberman and Kiang 1978), whereas the dashed line indicates mean thresholds for low-SR fibers of normal-hearing cats, computed using the low-SR correction data of Liberman (1978). (B) Acoustic threshold shifts computed using these two threshold contours. The dashed horizontal line indicates the mean threshold shift (26.4 dB). The approximate location of the stimulating electrode is indicated by the symbol in the bottom right of the graph.

