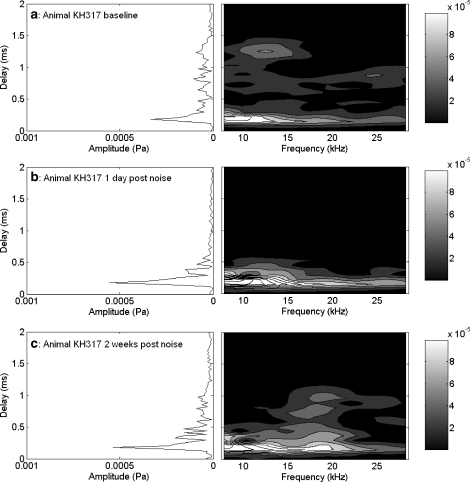
Fig. 9.
TDS and DFS plots for the EEOAE data shown in Figure 8a,b. There was significant LDC for the baseline measure (a), which was completely eliminated one day postexposure (b). By two weeks postexposure, LDC had returned, but in a very different configuration from baseline (c). Contour lines (and shaded areas) indicate 0.00002 Pa changes in amplitude. Amplitudes in the short-delay region exceeding 0.00010 Pa are all in white, and can be distinguished by additional contour lines.

