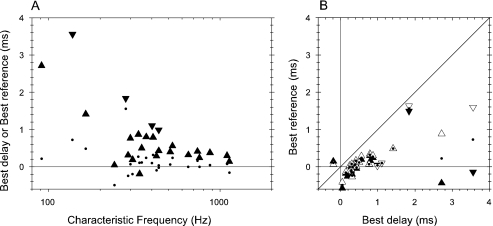
Fig. 5.
Comparison of best delay measured from coarse noise ITD functions and the best-reference position for noise ITD and tone ITD discrimination. (A) Filled triangles show best delay measured from coarse noise-ITD functions. Dots show the average of best-reference ITD for noise and tone ITD discrimination. (B) Comparison of best-reference position relative to best delay. Diagonal line represents equality. Open symbols show best-reference for tone ITD discrimination; filled symbols show best-reference for noise ITD discrimination. Dots show average of noise and tone best-reference ITDs.

