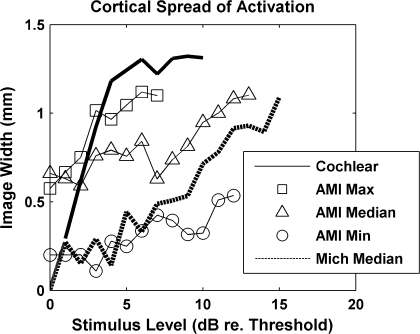
Fig. 10.
Primary auditory cortex image width curves plotted as a function of stimulus level relative to threshold (in dB). AMI image width curves corresponding to the maximum, median, and minimum spreading observed in A1 are presented. The median curve for spreading in A1 in response to ICC stimulation via a Michigan silicon-substrate probe with 400 μm2 sites was calculated from data obtained in another study (Lim and Anderson 2006). A typical cochlear image width curve was taken from Bierer and Middlebrooks (2002) and scaled appropriately to match the ordinate and abscissa scales presented in this figure.

