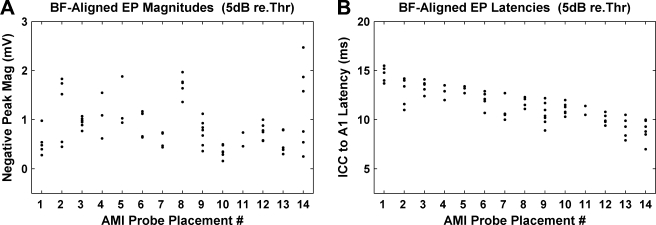
Fig. 12.
Magnitudes (A) and latencies (B) presented in Figure 11 but plotted as a function of AMI array placement number reordered with respect to decreasing latencies in B for visualization purposes. Probe placements 1 and 10, 5 and 14, and 7 and 8 are each from the same animal. Placement no. (total number of sites, total magnitude range in mV, total latency range in ms): 1 (5, 0.70, 1.8); 2 (5, 1.29, 3.0); 3 (6, 0.30, 1.7); 4 (3, 0.93, 1.5); 5 (3, 0.94, 0.7); 6 (6, 0.52, 2.2); 7 (4, 0.30, 2.7); 8 (5, 0.61, 1.2); 9 (7, 0.75, 3.3); 10 (6, 0.34, 1.7); 11 (2, 0.28, 1.4); 12 (6, 0.43, 1.4); 13 (5, 0.50, 2.6); 14 (6, 1.93, 3.0). For some array placements, fewer points than listed are visible due to overlapping (similar) values.

