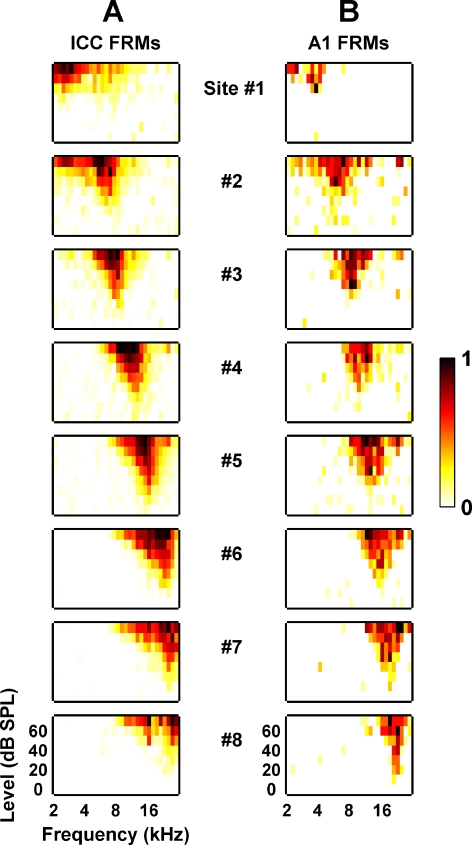
Fig. 3.
Frequency response maps recorded on eight different sites linearly spaced (200 μm apart) along the tonotopic gradient of the ICC (A) and A1 (B) as shown in Figure 2. Site 1 corresponds to the lowest BF site for both the AMI array and A1 probe. The lowest BF site corresponds to the site furthest away from the tip along the AMI array and the site located on the most rostral shank of the A1 probe. For each FRM, the abscissa is frequency (2–30 kHz, 8 steps/octave) and the ordinate is stimulus intensity (0–70 dB SPL, 10 dB steps). The colorscale corresponds to normalized driven spike rate where all negative FRM values were set to zero to improve visualization (for more details, see Methods: Data analysis). Generally, due to the large sites of the AMI array, the ICC FRMs exhibited broad distribution patterns across the frequency axis (compared with what is usually reported in other studies; Snyder et al. 2004, Lim and Anderson 2006).

