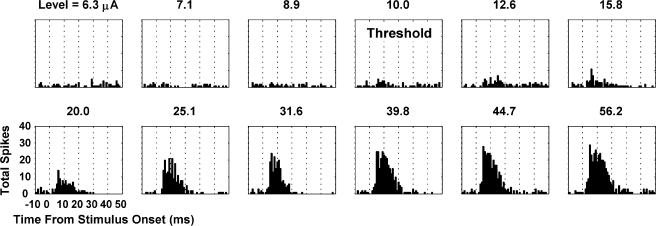
Fig. 4.
Poststimulus time histograms (1-ms bins) recorded on an A1 site (BF = 8 kHz) in response to varying levels of electrical stimulation of an AMI site (BF = 7 kHz). Threshold was determined using a visual method (for more details, see Methods: Data analysis).

