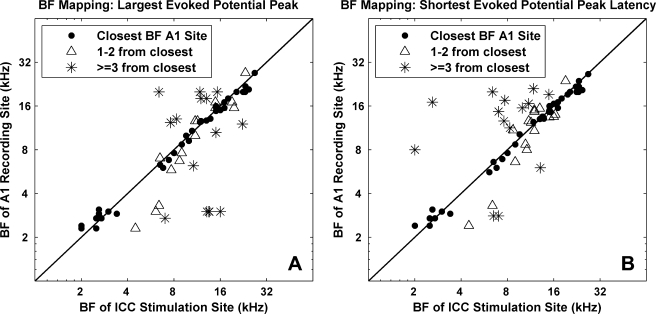
Fig. 9.
Best frequency mapping plots for evoked-potential properties (magnitude and latency) at 5 dB above electrical threshold for each AMI site (n = 69). (A) The BF of the A1 site with the largest evoked-potential peak for a stimulated AMI site is plotted against the BF of that AMI site. Diagonal line depicts perfect mapping, which is not always possible due to the set geometry of the electrode sites, thus inherent BF misalignment. ●, closest BF site; △, 1 to 2 sites away from closest BF site; ✳, >2 sites away. Distribution of symbols: ●, n = 37; △, n = 16; ✳, n = 16. (B) The BF of the A1 site with the shortest latency evoked-potential peak for a stimulated AMI site is plotted against the BF of that AMI site. Distribution of symbols: ●, n = 39; △, n = 16; ✳, n = 14.

