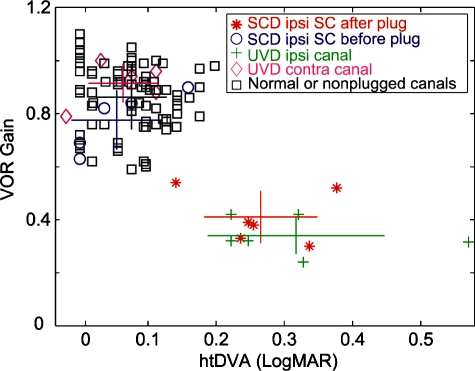
Fig. 4.
Relationship between VOR gain and htDVA score. Individual 3-D VOR gain and htDVA scores are represented by symbols. Star and cross symbols reflect semicircular canals/vestibular nerves that have been surgically lesioned. Open symbols reflect nonlesioned semicircular canals/vestibular nerves. The horizontal lines represent ±1 SD for the htDVA score, whereas the vertical lines represent ±1 SD for the 3-D VOR gain. Colored lines match colored symbols. The point where the lines intersect is the mean of both htDVA and VOR gain values.

