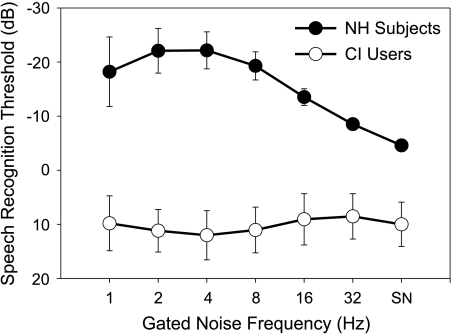
Fig. 2.
Mean speech recognition thresholds as a function of noise conditions in normal-hearing listeners and cochlear implant patients for the original unprocessed speech. The filled circles represent the data from the NH listeners while the open circles represent the data from the CI listeners. The error bars represent one standard deviation.

