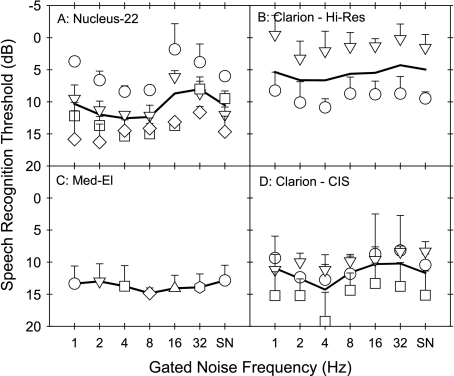
Fig. 3.
Individual and mean SRTs for CI subjects, grouped by device and speech processing strategy. A. Four patients with Nucleus-22 device; B. two patients with Clarion CII/Hi-Res strategy; C. one patient with Med-El device; D. three patients with Clarion/CIS strategy. The error bars represent one standard deviation.

