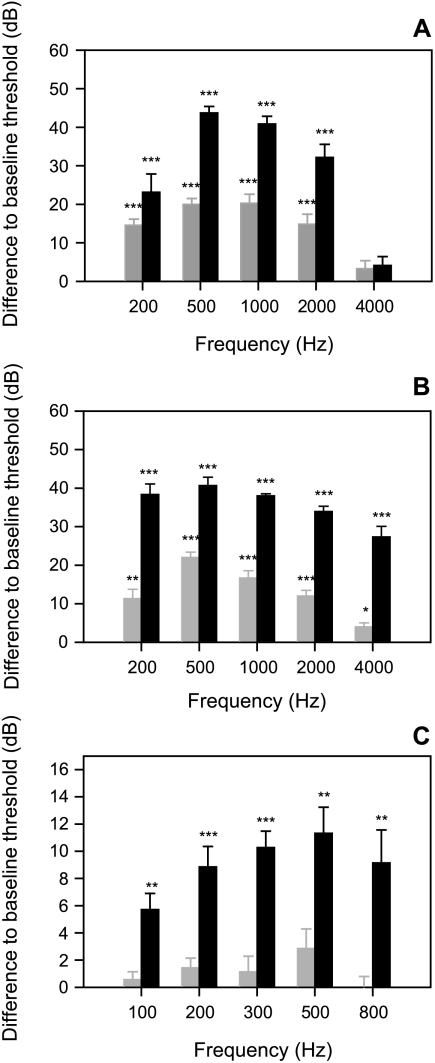
Fig. 3.
Differences of thresholds determined under white noise of 110 dB (grey bars) and 130 dB (black bars) to hearing thresholds under normal laboratory conditions of A. Carassius auratus, B. Platydoras costatus and C. Lepomis gibbosus. Asterisks indicate levels of significance (paired t-test; *p ≤ 0.05; **p ≤ 0.01, ***p ≤ 0.001).

