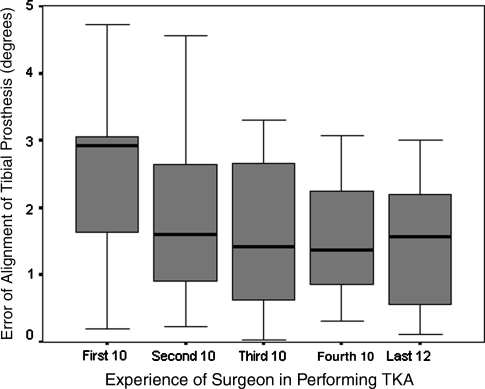
Fig. 2.
The experience of the surgeon in performing computer navigation TKA influenced radiographic alignment of the implanted tibial prostheses. The box represents the interquartile range that contains 50% of the value. The whiskers are lines extending from the box to the highest and the lowest values. The horizontal line in the box represents the mean.

