
Figure 6.
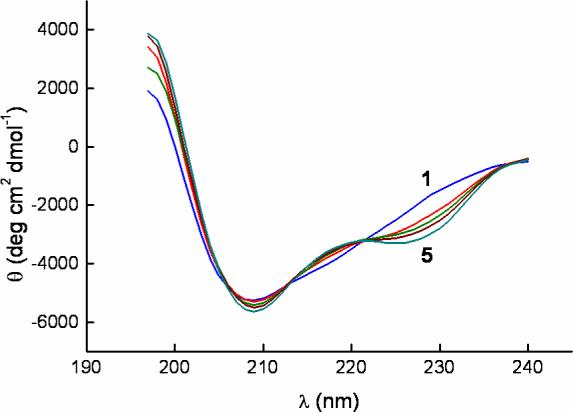
CD spectra of gp120 alone and in the presence of NBD-556. The concentrations of NBD-556 were 0, 5, 10, 20 and 300 μM from curve 1 to 5 as indicated in the figure. The concentration of gp120 was kept constant at 3.7 μM in all experiments.
Official websites use .gov
A
.gov website belongs to an official
government organization in the United States.
Secure .gov websites use HTTPS
A lock (
) or https:// means you've safely
connected to the .gov website. Share sensitive
information only on official, secure websites.
CD spectra of gp120 alone and in the presence of NBD-556. The concentrations of NBD-556 were 0, 5, 10, 20 and 300 μM from curve 1 to 5 as indicated in the figure. The concentration of gp120 was kept constant at 3.7 μM in all experiments.