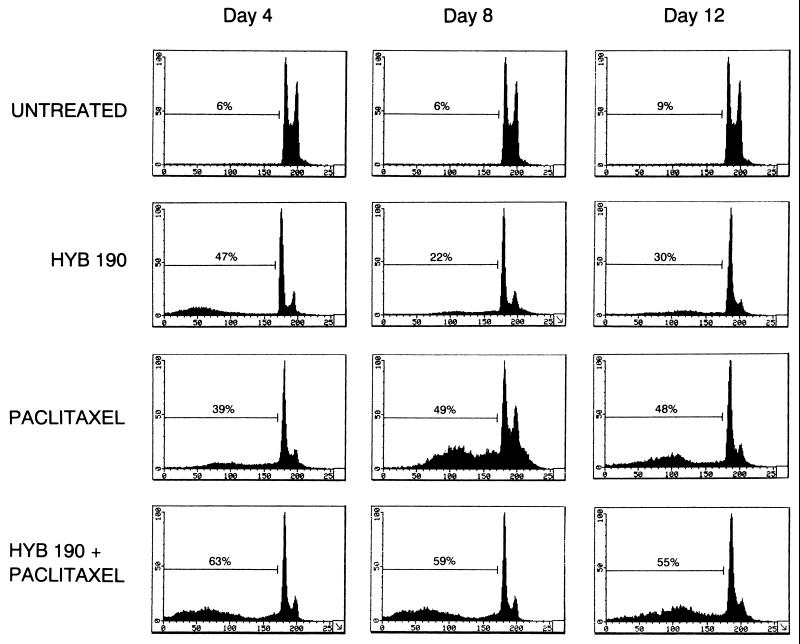
Figure 3.
Flow-cytometric analysis of the effect of 1 nM paclitaxel and/or 0.1 μM HYB 190 on the induction of apoptosis in OVCAR-3 cells. Apoptotic cells are present in the area indicated by a bar on the left side of each histogram. The numbers in each panel represent the percent of apoptotic cells calculated by flowcytometric analysis (25). Data represents one of three different experiments showing similar results.

