
Figure 3. Determining the Binding Constant (Kd) between gD and 3-O-[35S]sulfated HP octasaccharide.
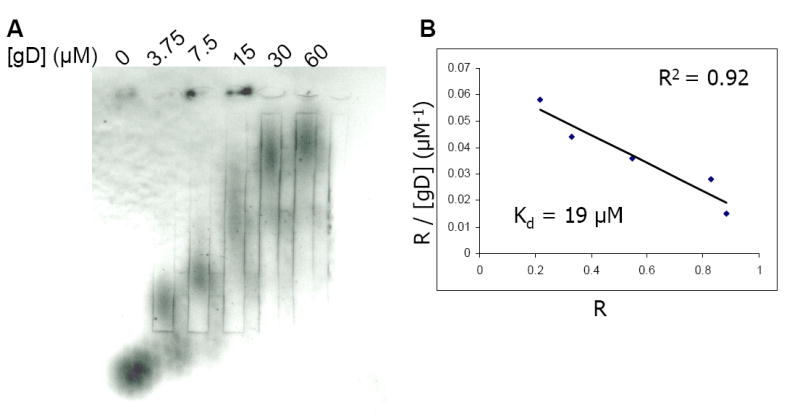
Panel A presents the autoradiography of the agarose gel in which purified 3-O-[35S]sulfated octasaccharide was subjected to electrophoresis through separation zones containing gD at concentrations indicated. Approximately 28,000 cpm (4 × 10-12 mol)/lane of the 3-O-[35S]sulfated octasaccharide was loaded into each zone. Panel B represents the plot of R/[gD]total versus R, where R = (M0-M)/M0. M0 is the migration of free 3-O-[35S]sulfated octasaccharide and M is the observed migration of 3-O-[35S]sulfated octasaccharide in the presence of gD at various concentrations. The plot yields a straight line with a slope of -1/Kd. The linear coefficient is presented as an R2 value and is shown in panel B.