
Figure 5.
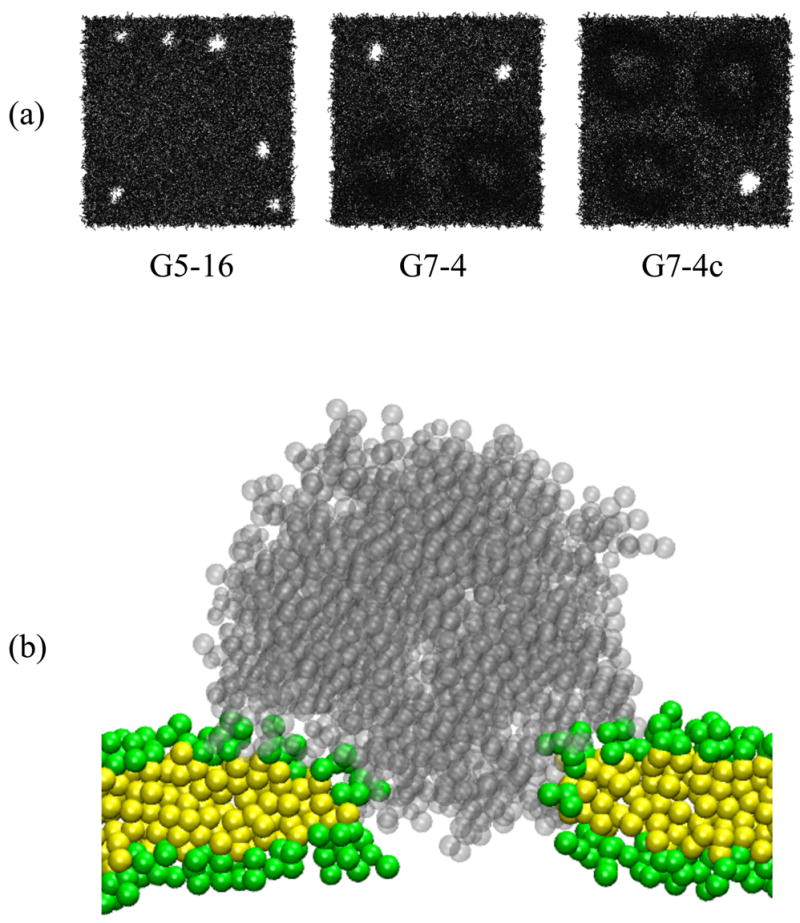
(a) Top view of the DMPC bilayer at the end (160 ns) of simulations G5-16, G7-4, and G7-4c. The dendrimer, water, and ions are omitted for clarity. (b) A snapshot of the dendrimer-induced pore in a DMPC bilayer at the end (160 ns) of the simulation G7-4c. Transparent gray dots represent a G7 dendrimer. Green and yellow dots represent head and tail groups of DMPC, respectively. Water and ions are omitted for clarity.