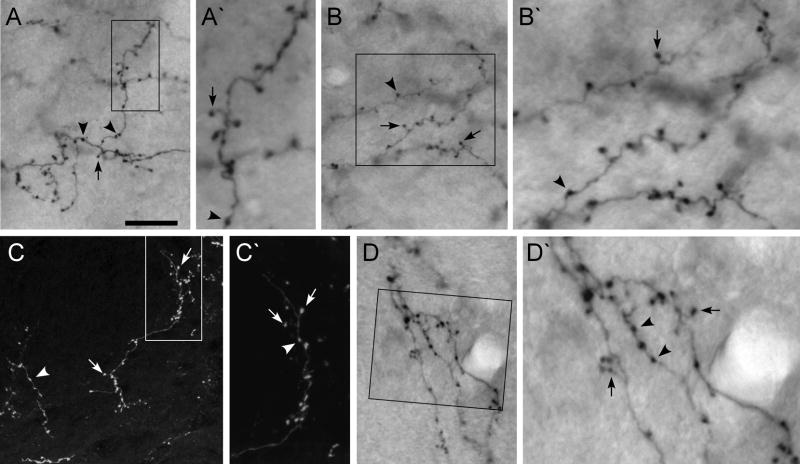
Fig. 11.
Comparison of labeled terminal projections from MI to the contralateral thalamus. A, A′: BDA-labeled terminals in the contralateral nucleus AM. B, B′: BDA-labeled terminals in the contralateral nucleus VL. C, C′: FR-labeled terminals in the contralateral nucleus VM. D, D′: BDA-labeled terminals in the contralateral nucleus VM. Arrows indicate “drumstick-shaped” varicosites and arrowheads indicate “beaded enlargements.” Rectangles in panels A, B, C and D, indicate regions depicted at higher magnification in panels A′, B′, C′, and D′. Scale bar represents 25 μm for panels A, B, C, and D, but represents 10 μm for panels A′, B′, C′, and D′.

