
Figure 3.
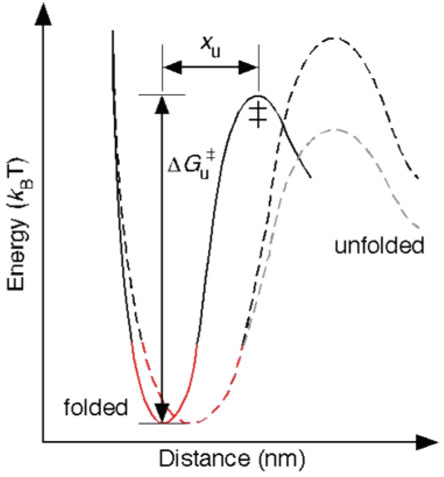
Unfolding energy profile of a structural segment in a membrane protein. DFS measurements give an estimate of the distance, xu, between the energy minimum of the folded state and the transition state (‡) as well as the height of the transition barrier, ΔGu‡. The rigidity of structural segments depends on the curvature of the potential well (shown in red) in the energy profile. Using xu and ΔGu‡ and assuming a parabolic shape of the potential well and a sharp transition barrier, we calculated the spring constant, κ, of each structural segment of rhodopsin and bacteriorhodopsin (Tables 1 and 2). The black dashed trace shows that an increase in xu decreases the rigidity of the structural segment in rhodopsin and bacteriorhodopsin. In general, the height of the energy barrier can increase or decrease with an increase in xu as shown by the black and gray dashed traces.