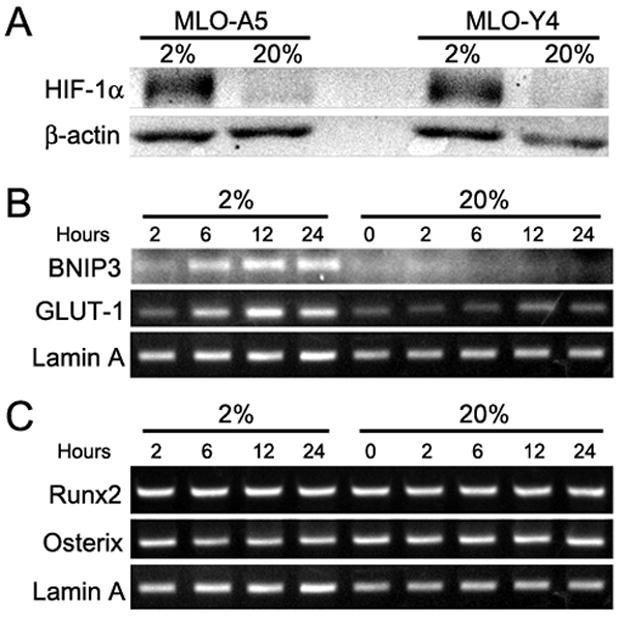
Figure 4.

Effect of O2 concentration on the MLO-A5 phenotype. (A) Western blot analysis of HIF-1α expression by MLO-A5 and MLO-Y4 cells after culture for 24 h at 20 or 2% O2. At 2% O2 HIF-1α was induced in both cell types. (B) RT-PCR analysis of HIF-1α target genes expressed by MLO-A5 cells in at 20 or 2% O2. Expression of GLUT-1 and Bnip3 was increased following culture at 2% O2. (C) RT-PCR analysis of bone-specific transcription factors expressed by MLO-A5 cells at 20 or 2% O2. Note that there were no changes in either RUNX2 or osterix at either O2 concentration.
