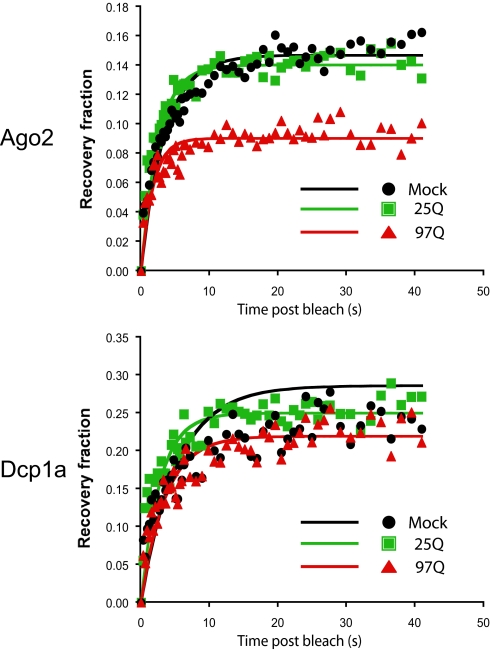
Fig. 6.
The fluorescence recovery of singly expressed RFP-Dcp1a or GFP-Ago2 within P bodies after photobleaching (mock, black) was compared with the fluorescence recovery of RFP-Dcp1a and GFP-Ago2 in HeLa cells expressing Htt590–25Q (green) or Htt590–97Q (red). The normalized recovery was fitted against a FRAP recovery model (solid lines). For clarity, not all points of the recovery data are plotted.

