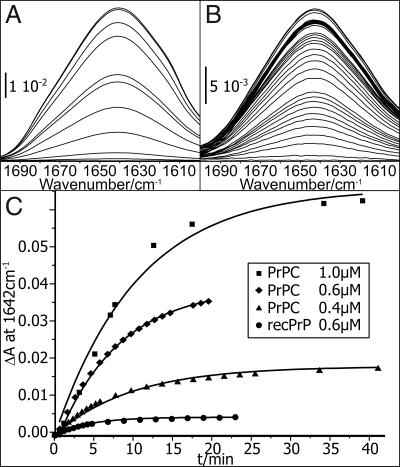
Fig. 1.
Membrane binding of PrPC and recPrP. The evolution of the amide I band displays the progression of membrane anchoring of PrPC. (A and B) A 1.0 μM protein solution (A) yields a higher final extinction, thus a higher final surface concentration than 0.4 μM (B). (C) The amplitudes at 1,642 cm−1 are plotted against time. The data points correspond to the different amplitudes in A and B, respectively. The very low adhesion of anchorless recPrP even at 0.6 μM (C) demonstrates specific membrane contact of PrPC via its GPI anchor.

