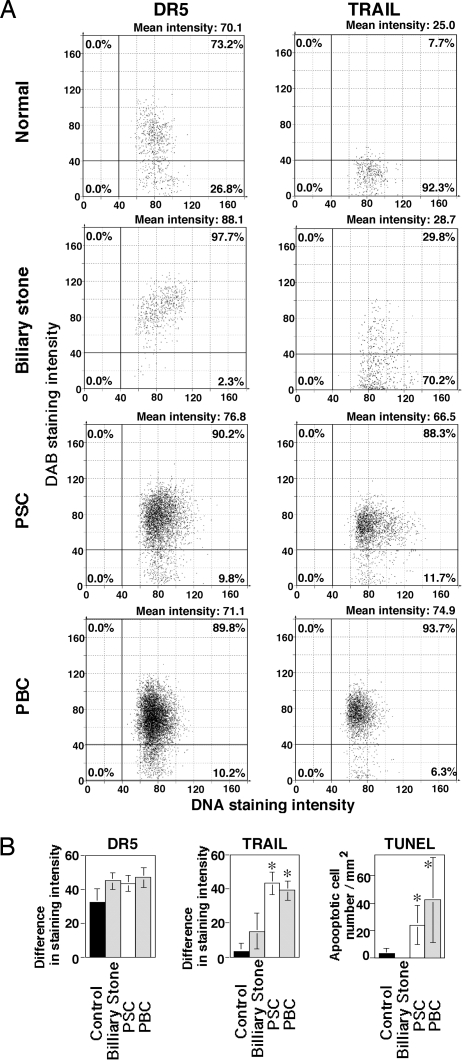
Fig. 5.
Increased TRAIL expression and apoptosis in cholangiocytes of PSC and PBC patients. (A) Quantification of TRAIL and DR5 expression on cholangiocytes. In the representative sections (presented in Fig. S3) of each group, 324 to 6,313 of cholangiocytes were analyzed using TissueFAXS, and the results were presented as scatter grams using HistoQuest. (B) TRAIL and DR5 expression and number of apoptotic cells in cholangiocytes. Sections were analyzed using MEAND, and data are represented as the mean ± SD (increased % of intensity) of sections from plural patients in each group. ∗, P < 0.05 compared with normal and patients with CBD obstruction caused by biliary stones.

