Fig. 3.
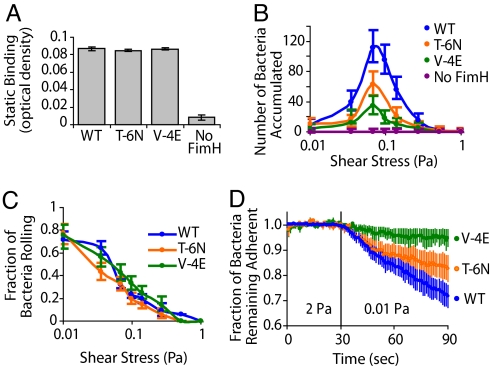
Static and dynamic bacterial adhesion to mannose-coated surfaces. Bacteria express FimH with different SPs or have no FimH. (A) Static binding by growth assay. Error bars represent SEM. (B) Surface accumulation of bacteria over 5 min at different shear stresses. Error bars represent the Poisson distribution 95% C.I. (C) Fraction of bacteria rolling on the surface relative to surface accumulated bacteria, which includes rolling and stationary. Error bars represent the binomial distribution 95% C.I. (not included where counts ≤1, which occurred only at the highest two shear levels). (D) Maintenance of adhesion after bacteria were bound to the surface statically, then subjected to high (2 Pa) and low (0.01 Pa) flow. Error bars at each second represent the SEM of three independent experiments. At the 90-s time point, a t test comparing WT and V-4E is significant (P = 0.015).

