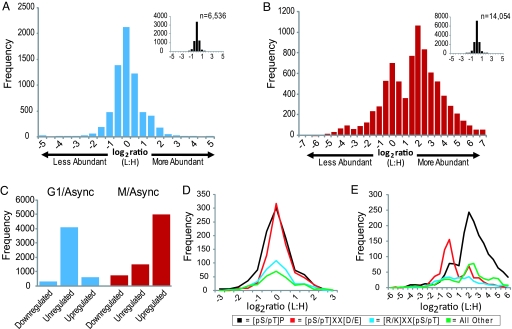
Fig. 2.
Phosphopeptide abundance distributions. (A and B) Log2-transformed light:heavy (arrested:asynchronous) ratios for all quantified phosphopeptides from G1 (A) and M (B) phase arrested cells. Bins are 0.5 units wide; e.g., the ‘0′ bin stretches from −0.25 to +0.25. (Insets) Shown is the distribution of unphosphorylated peptides in each experiment. (C) Peptides with ≥2.5-fold changes were deemed regulated and those with ≤1.5-fold changes unregulated. (D and E) Log2 phosphopeptide abundance distributions for peptides with different phosphorylation motifs are shown for G1 phase cells (D) and for mitotic cells (E). Phosphorylation sites were classified into 1 of 3 motifs, [pS/pT]-P, [pS/pT]-X-X-[D/E], or [K/R]-X-X-[pS/pT]. Sites lacking these motifs were grouped into “other.” Only peptides containing a single motif class were included in the analysis.

