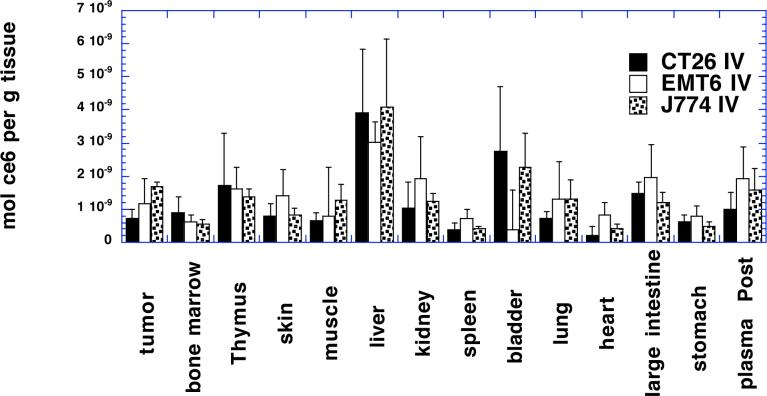
Figure 4.
Distribution of ce6 in organs and tumors from Balb/c mice 24 hours after IV injection of BSA-ce6-mal at a dose of 3.5 mg ce6 equivalent/kg. Tumors were dissolved in 1 M NaOH/0.2% SDS and fluorescence measured and converted to mol ce6 equivalent per gram of tissue with calibration curves. Values are means of triplicate tissue samples removed from at least six mice. Bars are SD.

