Figure 8.
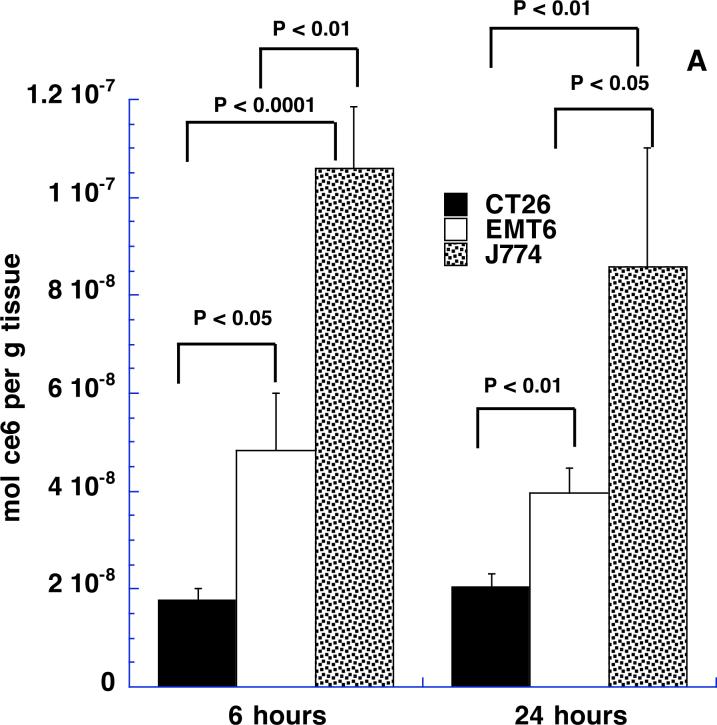
(A) Content of ce6 in tumors from Balb/c mice 6 and 24 hours after intratumoral injection of BSA-ce6-mal at a dose of 3.5 mg ce6 equivalent/kg. Values are means of triplicate determinations from at least 6 tumors. P values are from unpaired 2-tailed Students t-test.
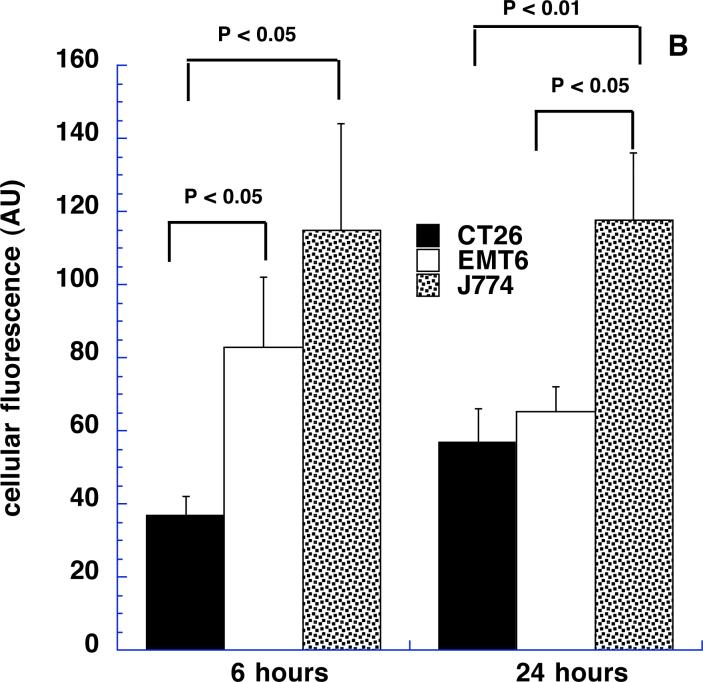
(B) Geometrical means obtained by FACScalibur software of red fluorescence obtained by flow cytometry from Balb/c mice tumors 6 and 24 hours after intratumoral injection described in Fig 7a. Values are means of triplicate determinations from at least 6 tumors. P values are from unpaired 2-tailed Students t-test.
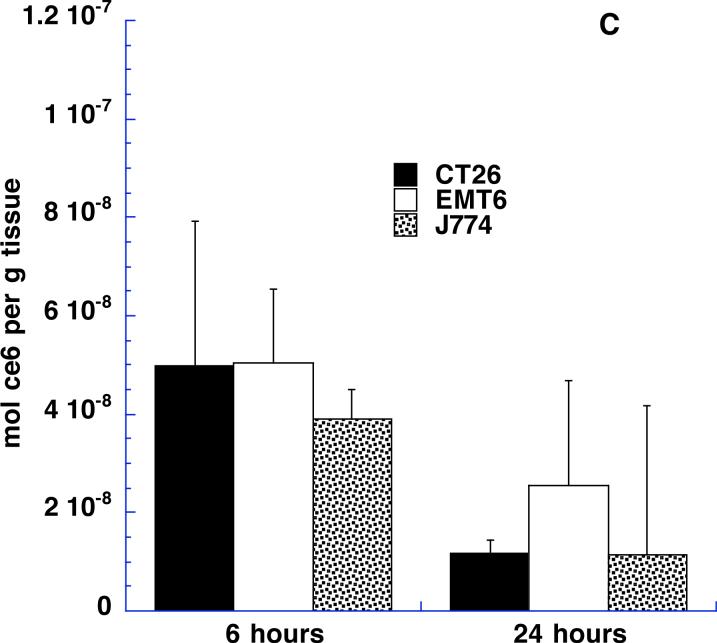
(C) Content of ce6 in tumors from Balb/c mice 6 and 24 hours after intratumoral injection of free ce6-mal at a dose of 3.5 mg ce6/kg. Values are means of triplicate determinations from at least 6 tumors.


