FIGURE 4.
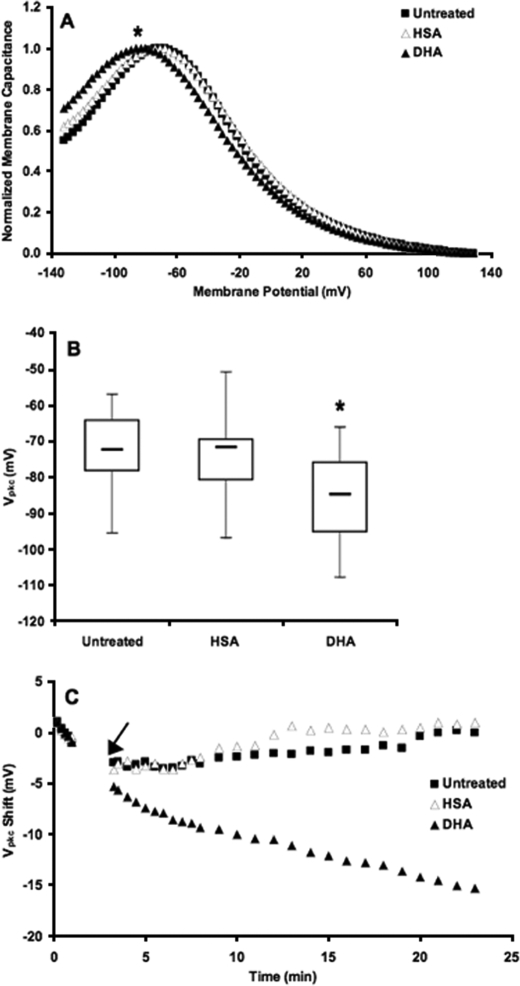
DHA shifts Vpkc. A, the mean Vpkc in untreated cells (▪, n = 39) was approximately –72 mV. Cells treated with HSA alone (▵, n = 30) exhibited no significant change in Vpkc relative to untreated cells (p > 0.46). In cells loaded with DHA (▴, n = 41), the mean Vpkc shifted in the hyperpolarizing direction to approximately –85 mV. This shift was statistically significant with respect to both untreated and HSA-treated cells (*, p < 0.0002). B, the box plots represent the distribution of steady-state Vpkc values for each treatment. C, shown is the change in Vpkc as a function of time after the establishment of a whole-cell patch. HSA (▵, n = 10–13) and DHA (▴, n = 17–18) were added 3 min after the patch was established, as indicated by the arrow. Vpkc changes rapidly upon the addition of DHA. Untreated (▪, n = 13–21) and HSA-treated cells have similar kinetic values, indicating that HSA does not contribute to the shift seen with DHA loading. The traces shown are averages from each respective group of the change in Vpkc of individual cells relative to their initial values.

